MAcquisition is the new software solution for your sensor telemetry. Measuring, configuring sensor telemetry, real-time visualisation of the measurement data and a comfortable data logging – easy to look & feel. The newly developed telemetry software offers the user many functions for easy setting and measurement. A configuration file allows you to start directly with your supplied measurement system without having to configure anything yourself – plug & play. Learn more!
Guaranteed simplicity of use and convenient adjustment of sensor telemetry for your measuring task
For ease of use, MAcquisition offers the Plug and Play solution for your measurement start-up. You receive a software configuration file with your new telemetry application, which enables you to measure immediately without any setting adjustments.
The application itself is easy to use. All explanations are integrated in the software. This makes the application not only intuitive to use, but also offers learning by doing with support through tool tips.
The system offers convenient telemetry setup (Figure 1). Health monitoring data is directly available to check the quality of the antenna installation and the current amplifier settings. With a simple click, the configurations such as gain, offset or sampling rate as well as the number of desired channels can be set. The measured value correction via temperature is also possible.
The new sensor setting offers a particularly convenient feature. The user can select from a variety of sensor types (half bridge, full, quarter bridge, insulated and non-insulated thermocouples, RTD sensor, etc.) and at the same time receives the schematic of the connection as well as the possibility to carry out the hardware tests.
Figure 1: Setting of the sensor type in the channel interface
Figure 2: 4-channel master system with configurable channels
Data Visualisation and Analysis – Online
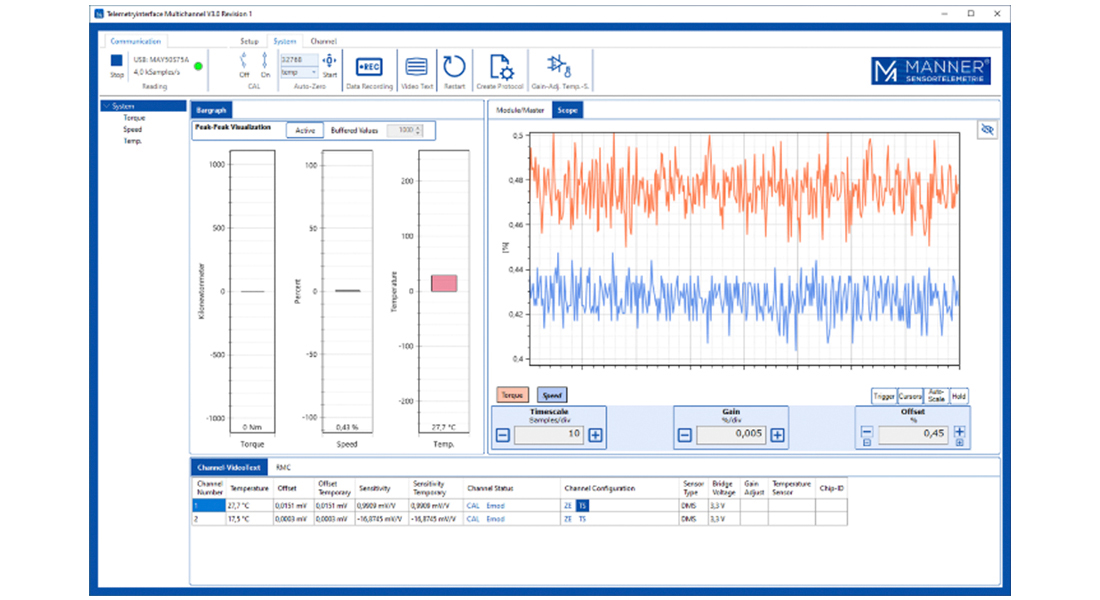
The new data visualisation options, including an integrated oscilloscope, offer extensive online analysis options.
The visualisation is freely configurable by the user with regard to the number of measuring channels to be displayed and their colour design.
Typical scope functions such as trigger, cursor and measurements on the signal are integrated.
The measurement channels can be displayed in one data window or in several data windows within the scope of the analysis and complete the concept. The signal can be zoomed as desired. Different diagrams and several scopes in parallel are also possible. Thus, all data analysis options are provided and allow the data to be viewed without further aids. This also includes online FFT, classification diagrams (waterfall diagrams).
Figure 3: Selected visualisation options
Figure 4: Selected visualisation options
Data acquisition – Freely configurable with automatic filing and filtering
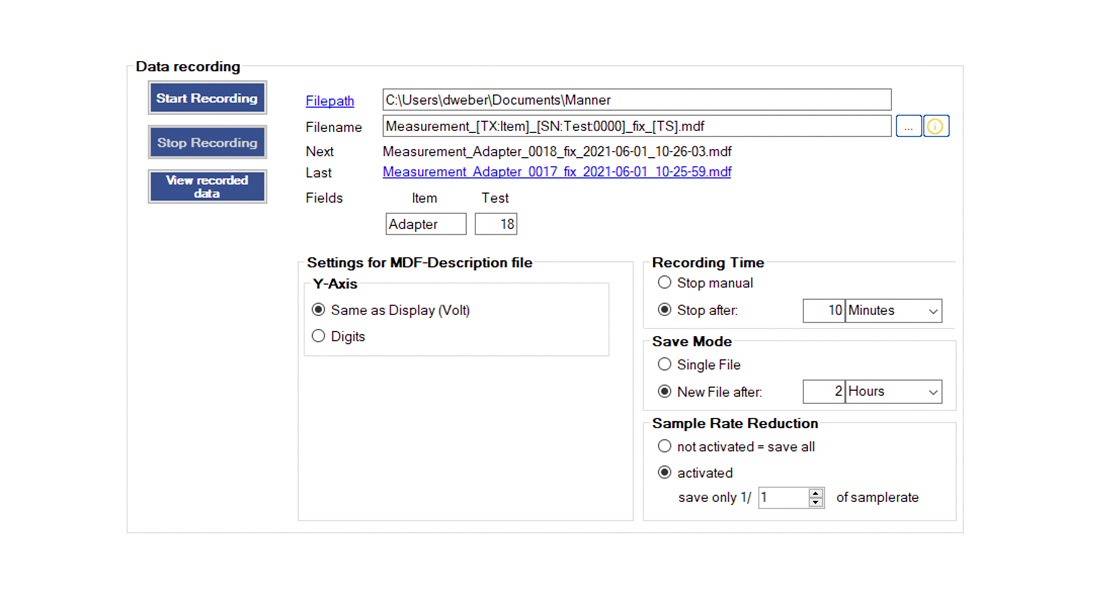
Optionally, an integrated data collection software with all data reduction options, export files and other conveniences can be purchased. The data collection also allows the creation of several automatically created files in order to record only certain time periods, if necessary, or to record only a certain time (e.g. 2 days). Storage is fully automatic.
In addition to the data view in the software, different export formats, which can be extended on customer request, are implemented. MANNER’s partner is Pro Flex. However, CSV export and other export formats are available.
The data can be recorded directly or in the converted unit such as Nm or a calculated quantity such as power (speed and torque).
Figure 5: Data collection interface